Funding and liquidity are used interchangeably — but the differences are stark. Diagnosing the strength of a bank's liquidity position.
By Sridhar Aiyangar, Founder & Managing Director · August 2026
Banks often discuss funding and liquidity together. The terms are closely related, but they are not interchangeable.
A bank can appear liquid today while carrying significant structural funding vulnerabilities and other balance-sheet risks such as IRRBB. Equally, a bank with a sound and diversified funding franchise may operate safely with a different liquidity-buffer profile from a bank whose funding is concentrated, confidence-sensitive or subject to significant refinancing risk.
This distinction matters because the adequacy of a liquidity buffer should not be assessed simply by asking "How much HQLA does the bank hold?" The more important question is:
That is fundamentally a Balance Sheet Management question.
Both terms are used jointly, but they mean different things.
Funding is the structure through which a bank finances its assets and activities — customer deposits, wholesale deposits, interbank funding, secured and unsecured borrowing, capital-market issuance and other liabilities. Its resilience depends not merely on its quantum, but on its stability, diversification, maturity, behaviour and ability to be refinanced.
But funding resilience cannot be considered independently of funding cost and its impact on profitability. A highly diversified and long-dated funding structure may appear safer, but if achieved at an excessive cost it can materially dilute margins and returns. The objective is not simply to maximise funding stability, but to optimise the trade-off between stability, concentration, tenor and cost.
Liquidity, by contrast, is the bank's capacity to meet its obligations as they fall due without incurring unacceptable costs or destabilising its franchise. It comes from several sources:
A bank may report a strong LCR and still have a vulnerable funding structure. The regulatory liquidity buffer provides protection against stress, but it does not eliminate the underlying source of that stress.
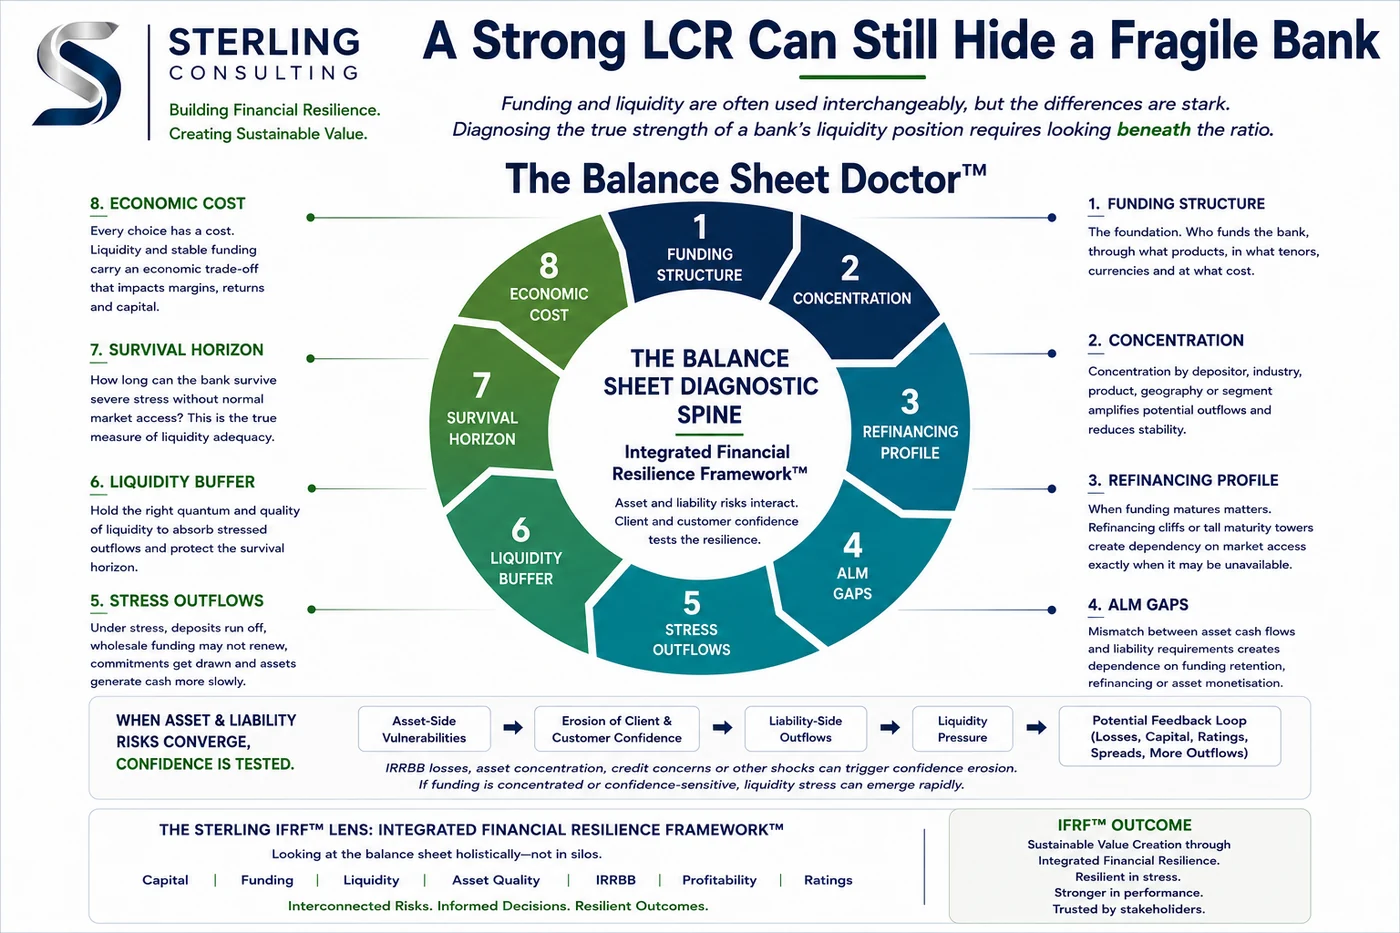
The two must therefore be assessed together. The relationship can be viewed as a diagnostic chain across the balance sheet:
Funding Structure → Concentration → Refinancing Profile → ALM Liquidity & Interest-rate Gaps → Stress Outflows → Liquidity Buffer → Survival Horizon → Economic Cost
Each element influences the next. The funding structure determines the stability of the liability base; concentrations amplify potential outflows; the refinancing profile determines when funding must be replaced; asset-liability maturity gaps determine dependence on continuing access to funding. Under stress, these structural vulnerabilities translate into cash outflows, which determine the liquidity buffer required and, ultimately, the bank's survival horizon.
But the chain does not end with resilience. There is an economic cost to every balance-sheet response: more HQLA carries negative carry relative to higher-yielding assets; longer-tenor or more diversified funding may increase funding costs; and excessive liquidity can dilute NIM, RAROC and ROE. The strategic BSM challenge is to optimise the entire chain rather than any one component in isolation.
The first question in assessing liquidity resilience should not be the size of the liquidity buffer. It should be: what could cause the bank to need that liquidity?
One of the most important answers is funding concentration. A deposit base of $10 billion consisting of hundreds of thousands of granular retail accounts is fundamentally different from $10 billion sourced from a small number of corporates, financial institutions or government-related entities. The accounting value may be identical. The liquidity behaviour is not.
Large individual depositors create potential liquidity shocks disproportionate to their share of total funding. This requires analysis of:
A highly concentrated deposit base can create a binary liquidity event: one relationship decision can produce a material cash outflow. This is why a regulatory runoff assumption should not be mistaken for a complete assessment of liquidity risk — the underlying depositor behaviour matters.
Depositors that appear diversified by legal name may be exposed to the same economic driver — Silicon Valley Bank being the obvious example. A bank may have hundreds of corporate depositors, but if a significant proportion belongs to one industry — real estate, construction, oil and gas, financial services, technology or government contractors — the deposits may behave in a correlated manner during stress, exacerbating outflows.
The same applies to customer segments. Concentrations in financial institutions, asset managers, government entities, SMEs or large corporates create common behavioural characteristics. A sharp decline in equity markets, for example, can trigger margin calls that force asset managers to draw on their bank deposits to post collateral. The correct question is not "how many depositors do we have?" but "how independently are those depositors likely to behave under stress?" Diversification must be assessed economically, not just numerically.
A funding franchise concentrated in one country or region can be exposed simultaneously to sovereign stress, political events, currency pressures, local rate changes, regulatory intervention, sector downturns and deterioration in market confidence.
For internationally active banks there is a further consideration: liquidity may not be freely transferable across entities and jurisdictions during stress. A group may appear liquid on a consolidated basis while individual subsidiaries, branches or currencies face constraints. Liquidity must be assessed where it is required, not merely where it exists — some of it may be trapped by regulatory restrictions.
Not all deposits behave alike. Current accounts, savings accounts, term deposits, notice deposits, brokered deposits, institutional deposits, wealth-management balances and rate-sensitive promotional products have very different behavioural characteristics. A bank heavily reliant on high-rate term deposits may have apparently stable contractual funding but substantial repricing and rollover risk; deposits gathered through promotional pricing may prove less relationship-driven than operating accounts embedded in customer payment and trade activity.
Product concentration therefore affects both the probability of outflow and the speed of outflow — and speed matters enormously in liquidity management.
Funding maturity is as important as funding concentration. A bank can have sufficient funding in aggregate but still face substantial liquidity risk if too much of it matures within a narrow period — the refinancing cliff.
Consider a bank with substantial wholesale funding maturing within the same month or quarter. The problem is not necessarily that the funding cannot be refinanced; it is that the bank is making a concentrated bet that market access will be available at the precise time it is required. That assumption may hold in normal conditions. Stress is precisely the environment in which it may fail.
A well-managed refinancing profile should resemble a staggered ladder rather than a series of tall towers. A tall maturity tower creates several risks at once:
The analysis therefore goes beyond the contractual maturity schedule. Banks should examine: how much funding matures, when, from whom, in which market, in which currency — and what happens if it cannot be refinanced. The objective is not merely to show that refinancing is historically achievable; it is to ensure that failure to refinance at a particular point does not become a liquidity event.
There is an economic dimension too. Extending liability tenor reduces maturity concentration but usually comes at a price; relying excessively on cheaper short-term funding can improve current-period margins while embedding significant future liquidity risk. The lowest-cost funding structure is not necessarily the optimal one, just as the longest-dated is not necessarily the most efficient. The objective is a diversified maturity profile that avoids excessive refinancing concentrations while maintaining an economically sustainable cost of funds.
Funding cannot be analysed independently of the assets it finances. A bank borrowing short and lending long creates a maturity transformation gap — intrinsic to banking. The question is not whether maturity transformation exists, but whether it remains within the bank's capacity to absorb the resulting liquidity risk.
Consider a balance sheet funded substantially through deposits and short-to-medium-term wholesale liabilities while carrying long-dated mortgages, corporate loans or illiquid investments. If liabilities mature or run off faster than assets generate cash, the bank must bridge the difference through deposit retention or replacement, wholesale refinancing, asset monetisation, secured borrowing, liquidity reserves or other contingency actions. This is the essence of the asset-liability maturity gap.
Contractual gaps are only the starting point; behavioural assumptions are critical. Some demand deposits are remarkably stable despite being contractually repayable overnight; some term funding may leave immediately at maturity if customers are rate-sensitive or confidence deteriorates; and loans may not generate cash on contractual schedule because of prepayments, extensions, refinancing or credit deterioration. Effective liquidity management therefore requires both contractual and behavioural maturity analysis.
A large structural mismatch increases dependence on continued depositor retention, refinancing capacity or asset monetisation. Under benign conditions that dependence may be almost invisible. Under stress, it becomes a direct call on the liquidity buffer.
Banks frequently begin with a regulatory requirement and size the buffer needed to maintain an acceptable LCR and NSFR, typically adding a margin over the minimum. That is necessary — but it should not be sufficient. The appropriate liquidity buffer should emerge from the risk characteristics of the balance sheet.
A bank with granular, behaviourally stable deposits, diversified funding sources, limited concentration, well-distributed maturities, strong market access, manageable ALM and interest-rate gaps, and substantial monetisable assets should have a fundamentally different liquidity-risk profile from a bank with concentrated institutional deposits, sector or geographic concentration, rate-sensitive fixed-rate assets funded short, large refinancing towers, long-dated illiquid assets and limited alternative funding capacity — even if both report the same LCR and NSFR.
The bridge between the two is liquidity stress testing, which should translate structural funding vulnerabilities into potential cash outflows:
These stresses should be overlaid rather than considered independently, because real liquidity crises rarely occur as isolated shocks. A downgrade can increase wholesale refinancing costs; that may trigger depositor concerns; outflows may force asset monetisation; asset sales may crystallise losses; those losses may weaken capital and further undermine confidence. Liquidity risk is often non-linear and self-reinforcing.
There is a further dimension conventional metrics struggle to capture: client and customer confidence. Confidence is not an independent balance-sheet risk — it is the mechanism through which weaknesses elsewhere are transmitted into liquidity stress.
A bank may have an asset-side vulnerability that initially appears manageable. IRRBB, valuation losses on securities, deteriorating credit quality or excessive asset concentration may not, by themselves, create an immediate cash requirement. But if those vulnerabilities become visible to depositors, investors or markets, the reaction emerges on the liability side.
Asset-side weakness → Loss of confidence → Liability-side outflows → Liquidity pressure
Silicon Valley Bank is a powerful example. SVB had significant exposure to longer-duration fixed-rate securities whose economic value had fallen as rates rose — an asset-side interest-rate and duration risk. At the same time its funding was heavily concentrated in technology and venture-capital customers, with a substantial proportion of large uninsured deposits — a liability-side concentration and behavioural risk. Neither should have been viewed independently.
As concerns intensified, the asset-side vulnerability affected depositor confidence, and the concentrated, highly connected depositor base amplified the speed at which that loss of confidence became withdrawals. What had been an IRRBB and valuation problem became a funding and liquidity problem — and monetising assets to meet the need crystallised losses that had previously been largely unrealised.
IRRBB / Asset Duration Risk → Unrealised Losses → Confidence Erosion → Concentrated Deposit Outflows → Liquidity Requirement → Asset Monetisation → Loss Crystallisation → Further Confidence Erosion
The lesson extends well beyond SVB. A liquidity assessment should ask not only whether funding is concentrated, but whether an adverse development elsewhere on the balance sheet could cause those concentrated customers to behave in a correlated manner. A bank may appear adequately capitalised and liquid when risks are considered individually; the real vulnerability emerges when they interact. Credit Suisse — which failed on a loss of market and customer confidence — is another recent example.
This is precisely the proposition behind Sterling Consulting's Integrated Financial Resilience Framework (IFRF™): resilience cannot be assessed by examining capital, funding, liquidity, asset quality, interest-rate risk, profitability or ratings in separate silos. The relevant question is how those risks interact — and whether stress in one part of the system can transmit rapidly into another.
Under the IFRF lens, funding concentration is not simply a liability-side metric; it is assessed against the asset risks and confidence triggers that could cause depositors to leave. IRRBB is not simply an earnings or economic-value sensitivity; it is assessed for its consequences for capital, market confidence, liquidity and funding access. And the liquidity buffer is not an isolated stock of HQLA — it is the residual protection required after considering the resilience of the funding franchise, refinancing profile, ALM gaps, asset-side vulnerabilities, behavioural stresses and the credibility of contingency actions.
Asset-Side Risk + Liability-Side Vulnerability + Confidence Shock → Liquidity Stress
This interaction sits across the broader diagnostic chain:
Funding Structure → Concentration → Refinancing Profile → ALM Gaps → Stress Outflows → Liquidity Buffer → Survival Horizon → Economic Cost
The first relationship explains how a balance-sheet vulnerability becomes a liquidity event; the second assesses whether the institution has sufficient resilience to absorb it, and at what economic cost. That is the essence of an integrated financial resilience assessment: not whether each individual ratio passes its threshold, but whether the balance sheet as a whole remains resilient when risks interact.
Management and Boards should look beyond the absolute amount of HQLA or the LCR and NSFR ratios. A more powerful question is: how long can the bank survive a severe but plausible disruption without relying on normal market access? That is the bank's survival horizon. The answer should reflect immediately available liquidity, realistic asset monetisation and secured borrowing capacity, contractual cash flows, stressed deposit runoff, refinancing requirements, collateral and margin requirements, contingent liabilities, and the operational ability to execute contingency actions — culminating in appropriate risk-appetite thresholds and early-warning indicators.
A $5 billion liquidity buffer means little in isolation. If plausible stressed outflows are $500 million per month, it represents one level of resilience. If a concentrated funding base could generate $3 billion of outflows within days, it represents something entirely different. Liquidity adequacy is relative to the speed and magnitude of potential cash-flow stress.
Liquidity carries an economic cost. Excessive holdings of low-yielding HQLA can dilute net interest margin, return on assets, RAROC and ultimately ROE. The objective of BSM is not to maximise liquidity but to optimise it — holding a buffer sufficient to absorb the bank's actual risk profile while avoiding unnecessary structural drag on earnings.
The optimisation challenge is therefore to determine the most efficient combination of funding stability, concentration, tenor, cost and liquidity buffer that delivers the required resilience.
Reducing depositor concentration, diversifying sectors, developing more granular operating deposits, staggering wholesale maturities and reducing structural maturity gaps all lower the underlying liquidity risk. The balance sheet becomes safer — and may need a smaller buffer.
A healthy liquidity position cannot be diagnosed from one ratio. LCR matters. NSFR matters. HQLA matters. But none should be viewed in isolation. The diagnosis should connect the whole chain:
Funding Structure → Concentration → Refinancing Profile → Asset-Liability Maturity & Interest-Rate Gaps → Stress Outflows → Liquidity Buffer → Survival Horizon → Economic Cost
That is the difference between liquidity compliance and liquidity resilience. A strong balance sheet is not one that simply carries a large stock of liquid assets. It is one in which the funding structure reduces the probability and severity of liquidity stress; refinancing requirements are distributed and manageable; asset and liability cash flows are understood; contingency capacity is credible; and the liquidity buffer is calibrated to the residual risks that remain.
The ultimate objective is therefore not "hold more liquidity." It is:
That is the discipline of strategic Balance Sheet Management.
Join the discussion on LinkedIn
Part of The Balance Sheet Doctor — Sterling Consulting's Building Financial Resilience series.
This insight examines how funding structure, concentration, refinancing and ALM gaps determine the liquidity a bank truly needs — and how asset-side risk and lost confidence transmit across the balance sheet to earnings.
Explore the full interdependency map →If you want an independent view of how your funding structure, concentrations and ALM gaps translate into the liquidity you actually need under stress, a structured diagnostic can surface it before it matters.
Request a Diagnostic Review